
Reaching a professional level of day trader isn’t an easy task. It requires discipline, excellent risk and money management skills, and a solid working knowledge of the market. A thorough understanding of the various technical indicators is also a necessity to reach the top. These trading indicators offer technical analysis of market conditions as well as insight into market psychology and the supply and demand of securities. They can even provide reliable predictions of what to do based on complex computation.
One of the most commonly seen indicators on a professional trader’s chart is moving average. Another frequently utilized indicator is the OBV, or on-balance volume indicator. It is used to measure the flow of volume — both positive and negative — in a security over time. Lastly is the very useful relative strength index, or RSI. Used to help gauge momentum and trend strength, this indicator plots recent price gains versus recent price losses in a range between zero and 100. Its most basic use is to signify an overbought or oversold condition for an asset.
When RSI rises above 70, the asset is considered overbought and could decline; therefore, it may be time to sell. Conversely, falling below 30 signifies oversold and a time to buy or allow existing stock to rally. RSI is also used to measure divergence as well as in evaluating support and resistance levels, making it a valuable, versatile tool. For more on this, check out the graphic below.
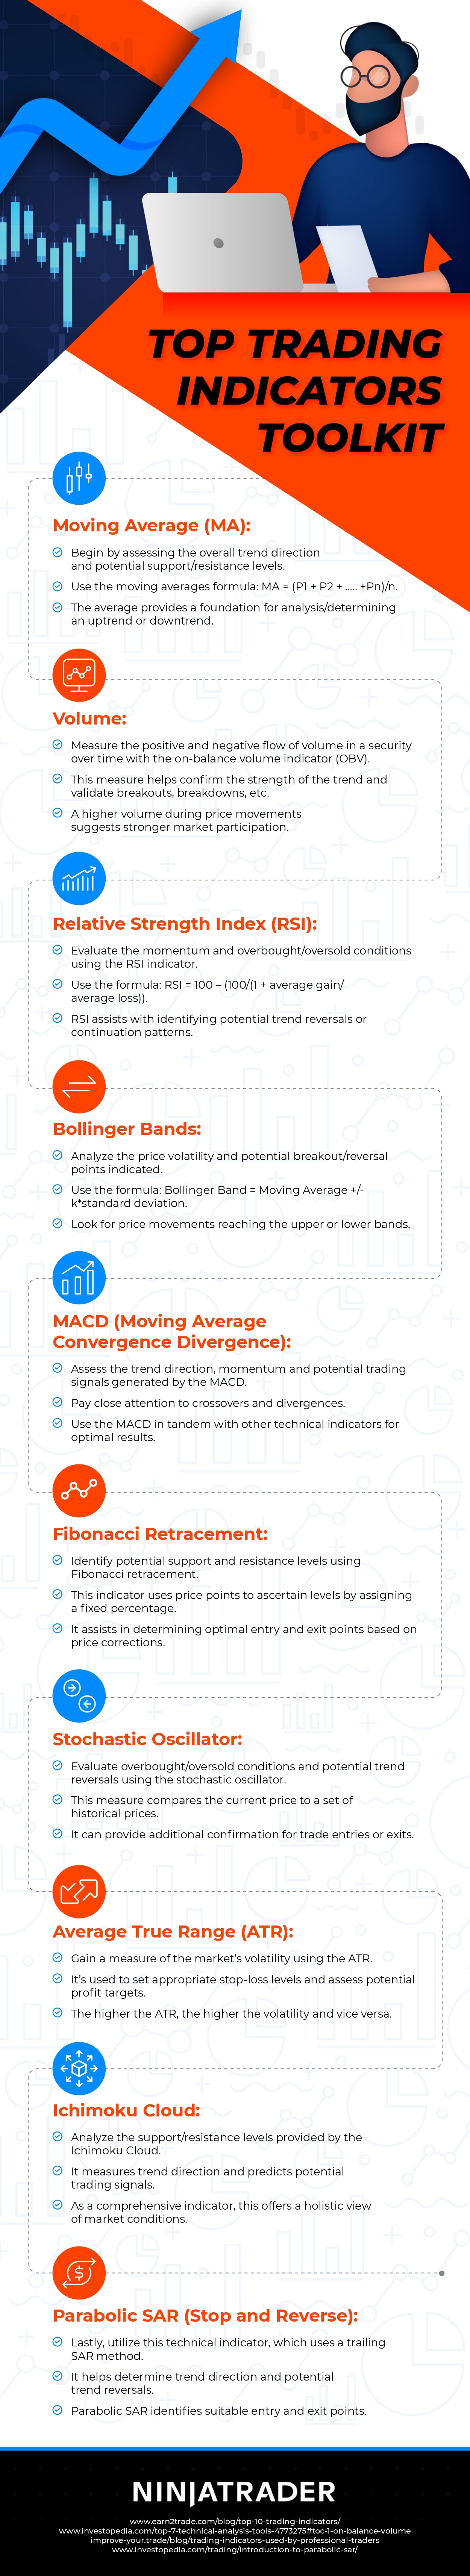
Top Trading Indicators Toolkit from NinjaTrader, a futures broker


Comments